You ask, AI builds it. Test done, PDF ready. Your device, live.
Connect PLCs and instruments through 24 native drivers, build screens, alarms and tests that end in a PDF report. Ask Claude, Codex or any assistant with MCP, or do it all yourself in the interface.
Everything unlocked. You pay only to run nonstop.
- Windows 10 and 11, 64-bit
- Installs without admin rights
- Every feature unlocked
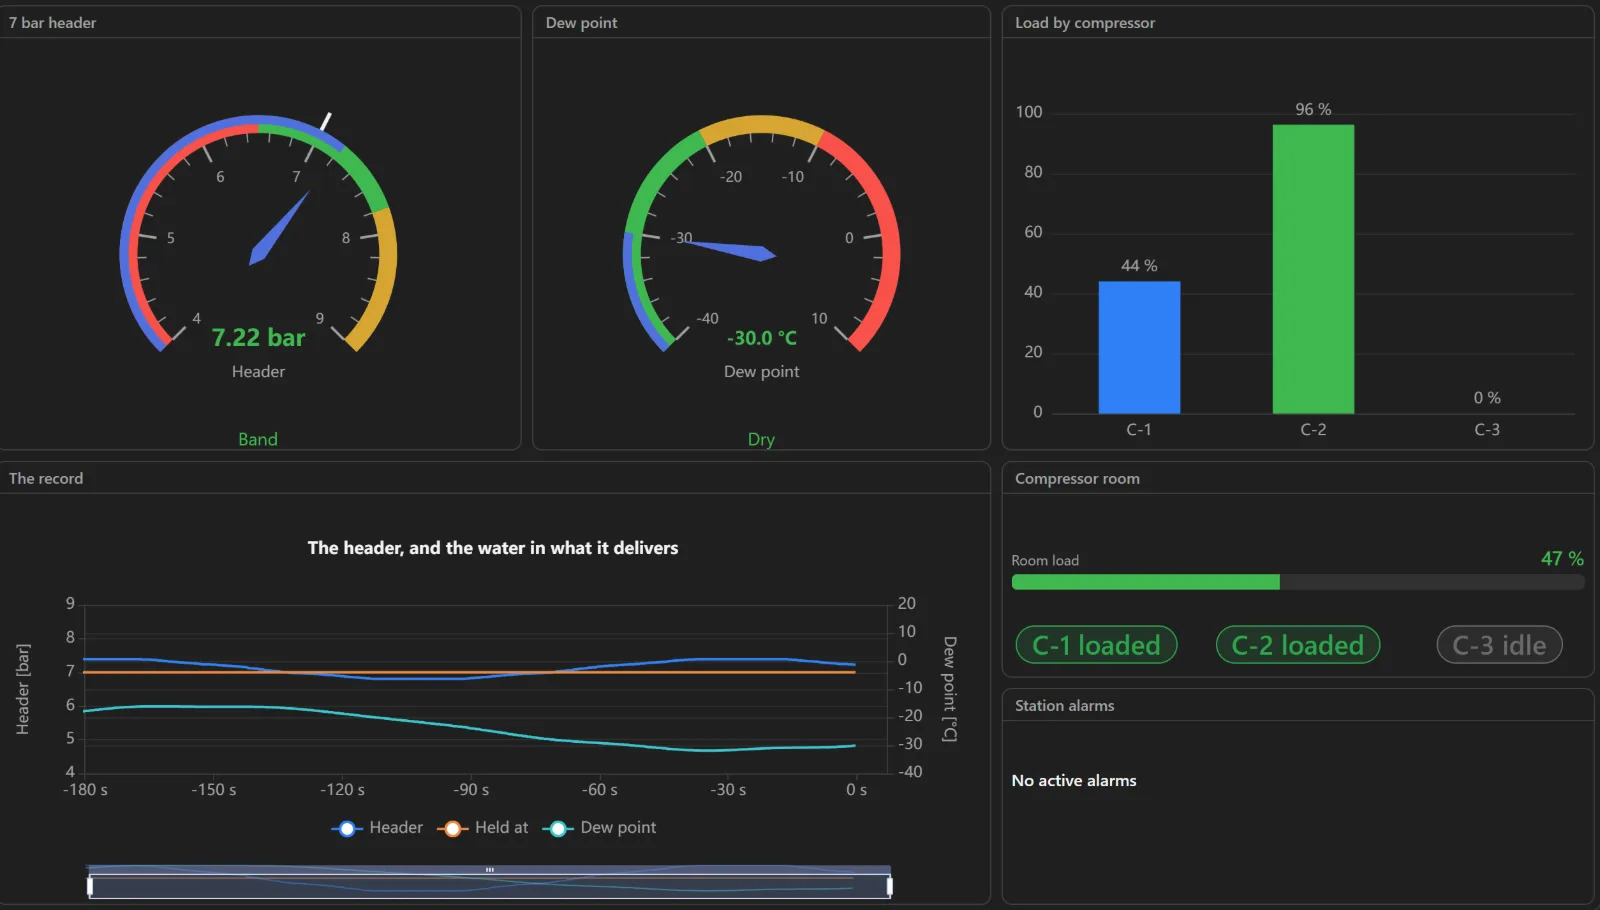
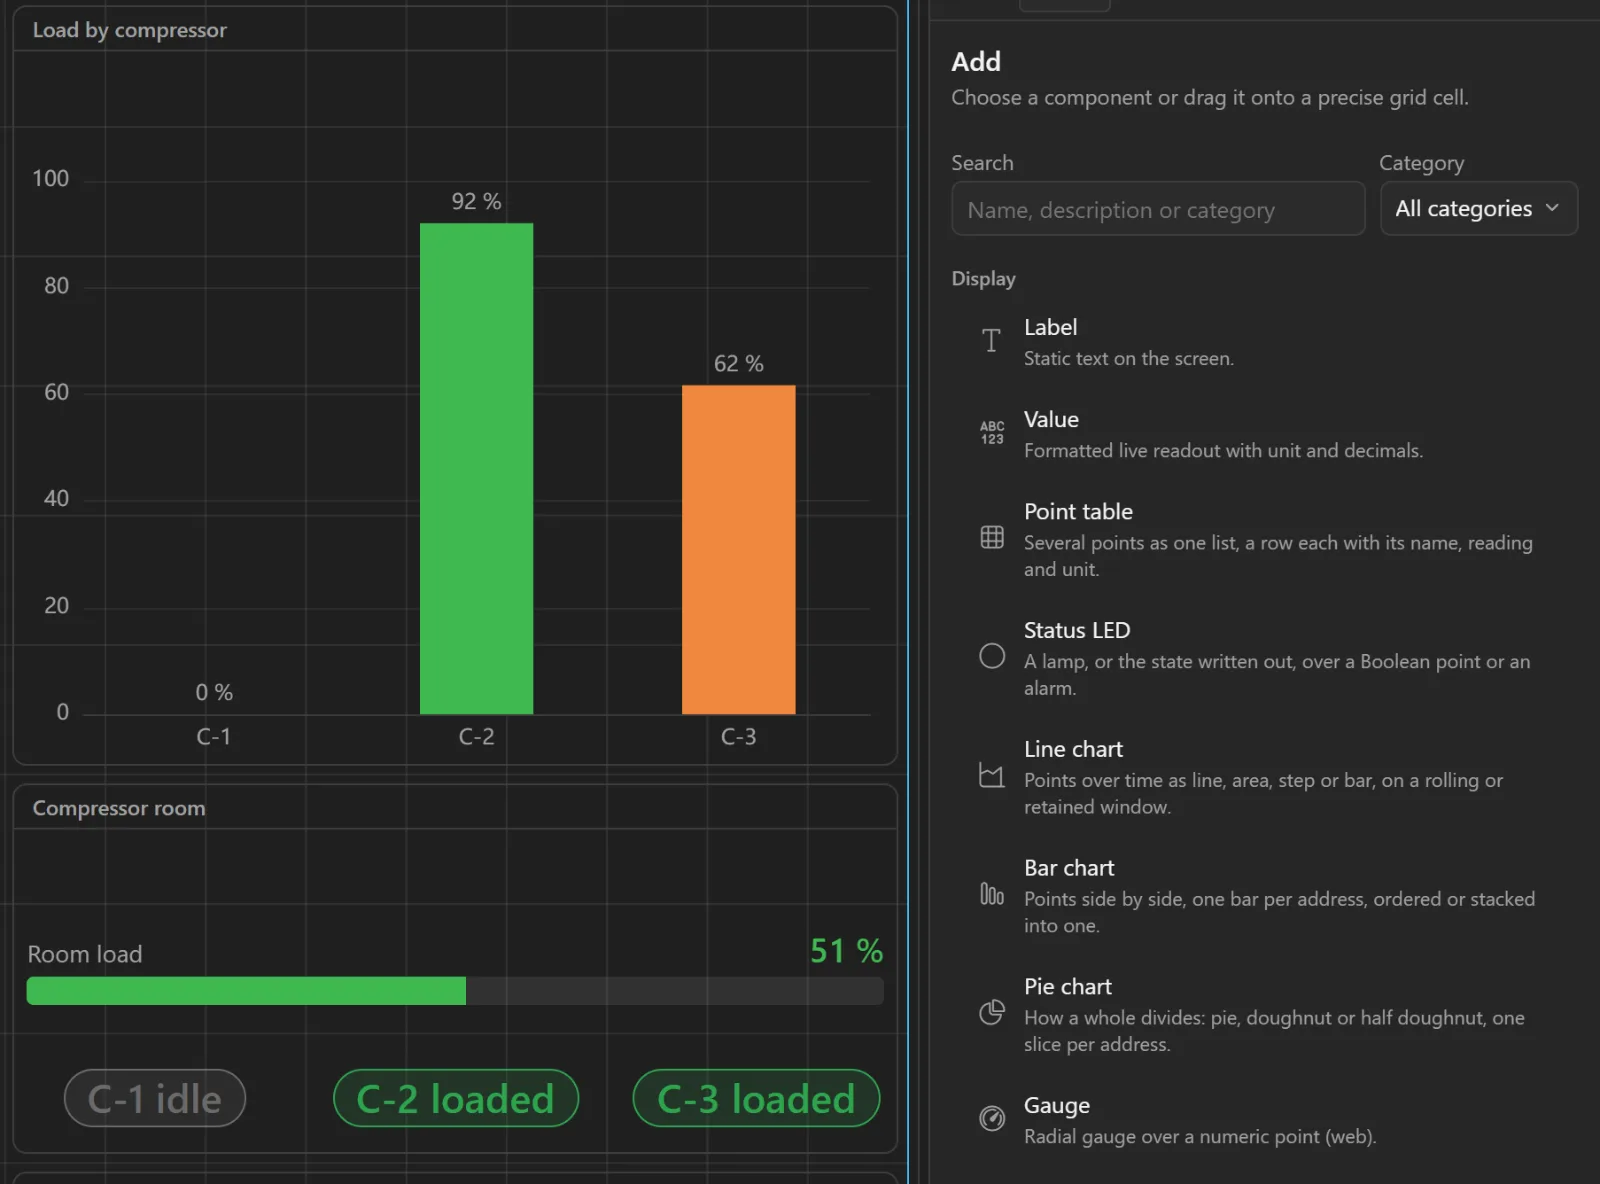
Build a screen of the compressed-air plant: header pressure, dew point, the load of each compressor and the last three minutes.
Done: one screen, built from the signals the station already reads.
- On the Microsoft Store
- 24 native drivers
- MCP, the open standard for AI agents
- Runs on your computer. Your data stays there.
Test done, PDF ready.
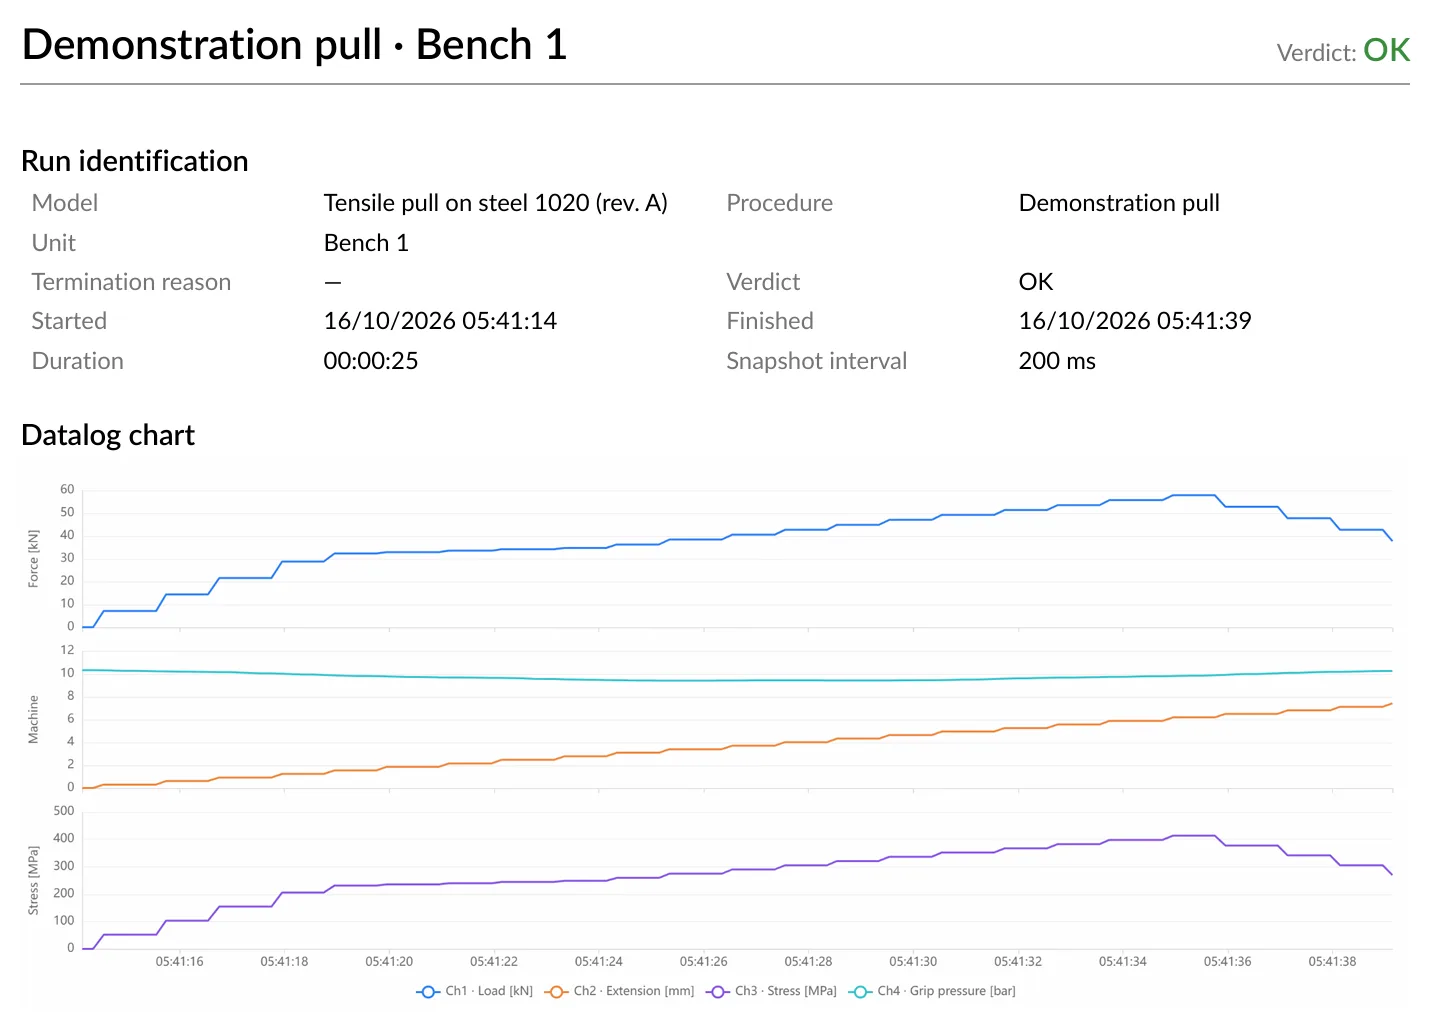
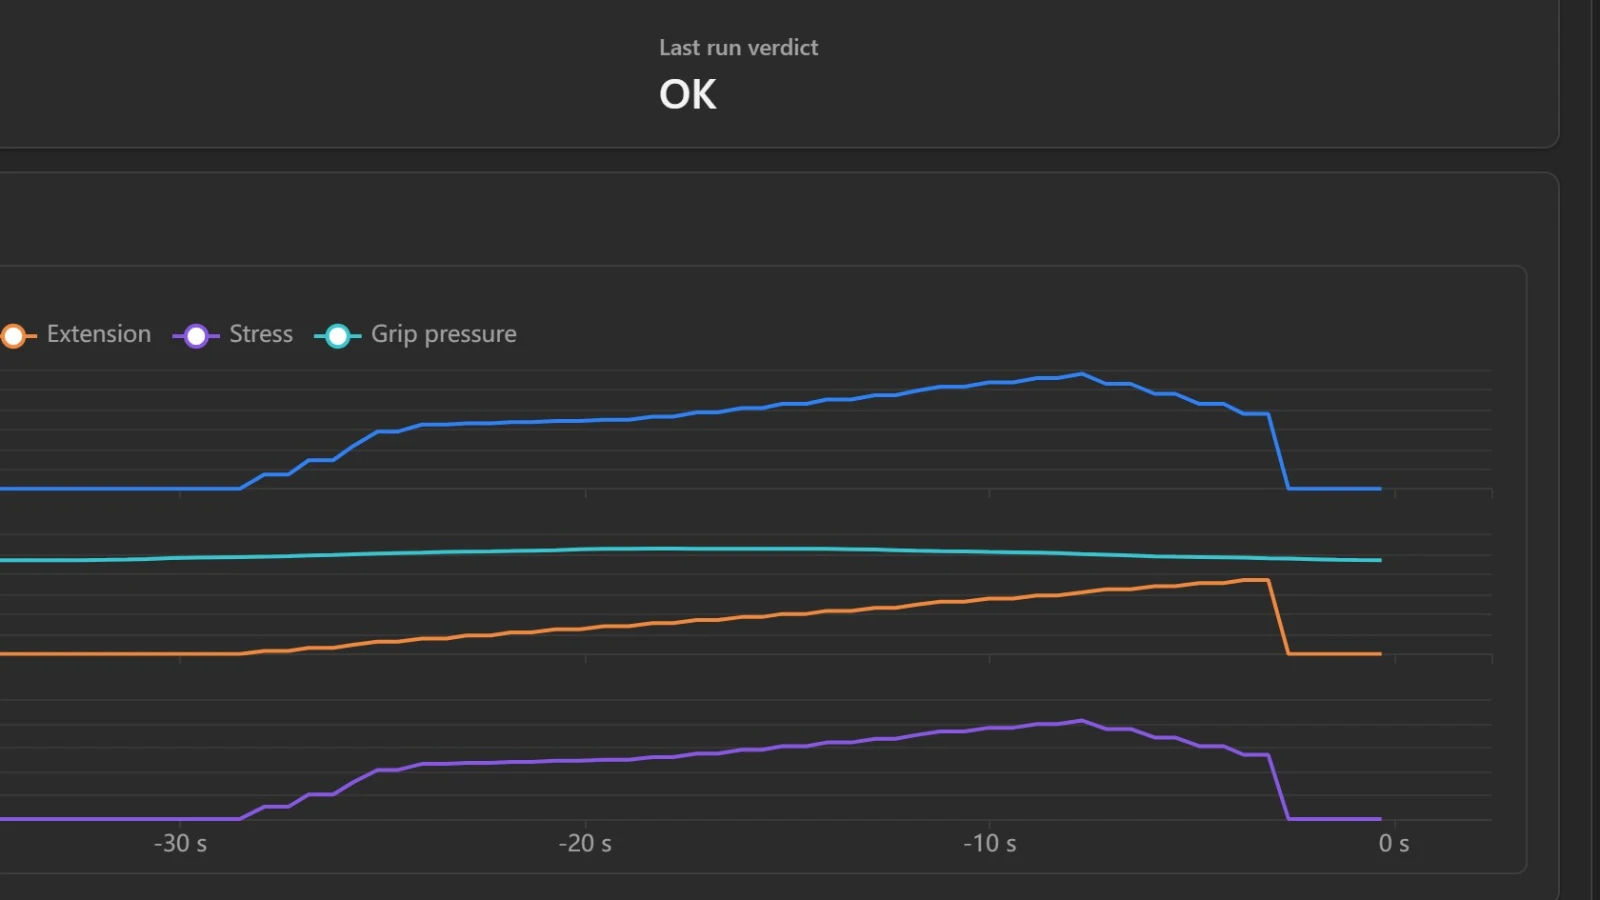
Describe a test once and run it on every bench. Each run ends OK or NOK.
- A verdict per unit, with its serial number and lot.
- A PDF report with the chart, printed with your logo.
- A label printed the moment the test ends.
Your device, live.
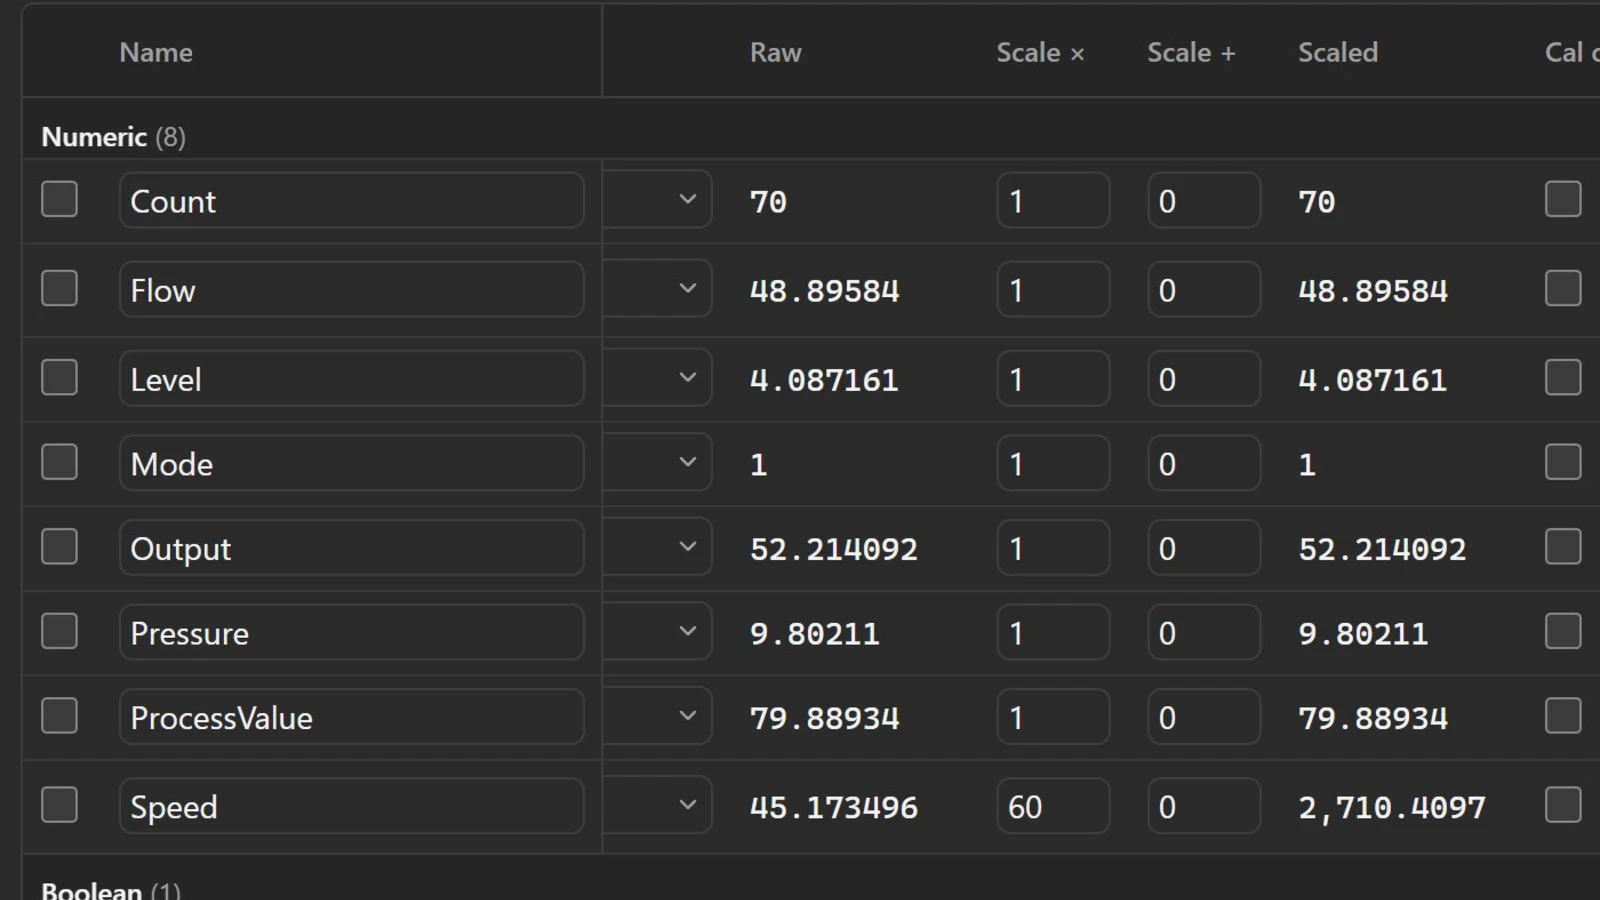
Pick the driver, point it at the device, and every reading becomes a tag with a live value in your units.
- Every driver comes in the installer. Nothing to buy.
- Scale and offset turn a raw reading into a real value, with its health on every row.
- No configuration file and no script: every setting is a form.
Dashboards, drag & drop.
Put gauges, charts, buttons and equipment symbols on a grid and link each one to a live value.
- The screen keeps showing live values while you build it.
- Give a finished screen the whole monitor, or open it on a tablet.
- Light or dark, with your own logo and name.
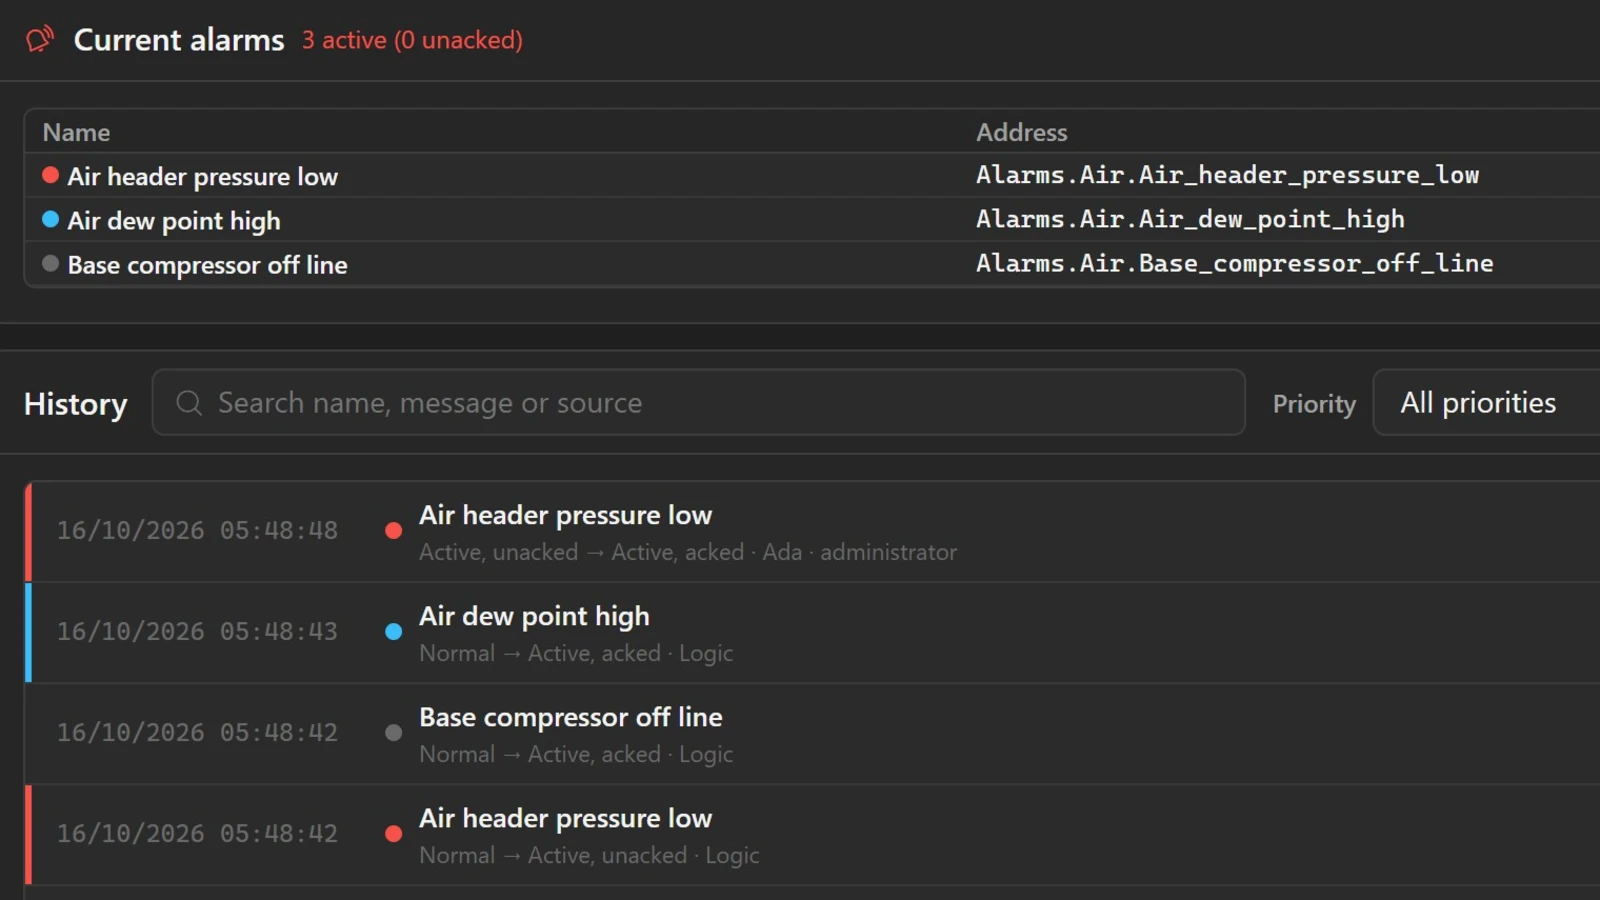
Alarms that get noticed.
Watch a condition, announce it, and wait for someone to acknowledge it. This is the supervisory control and data acquisition (SCADA) side of the station.
- Acknowledge what is active, one at a time or all at once.
- Every occurrence keeps who did what and when.
- Rules in plain JavaScript, with mistakes flagged as you type.
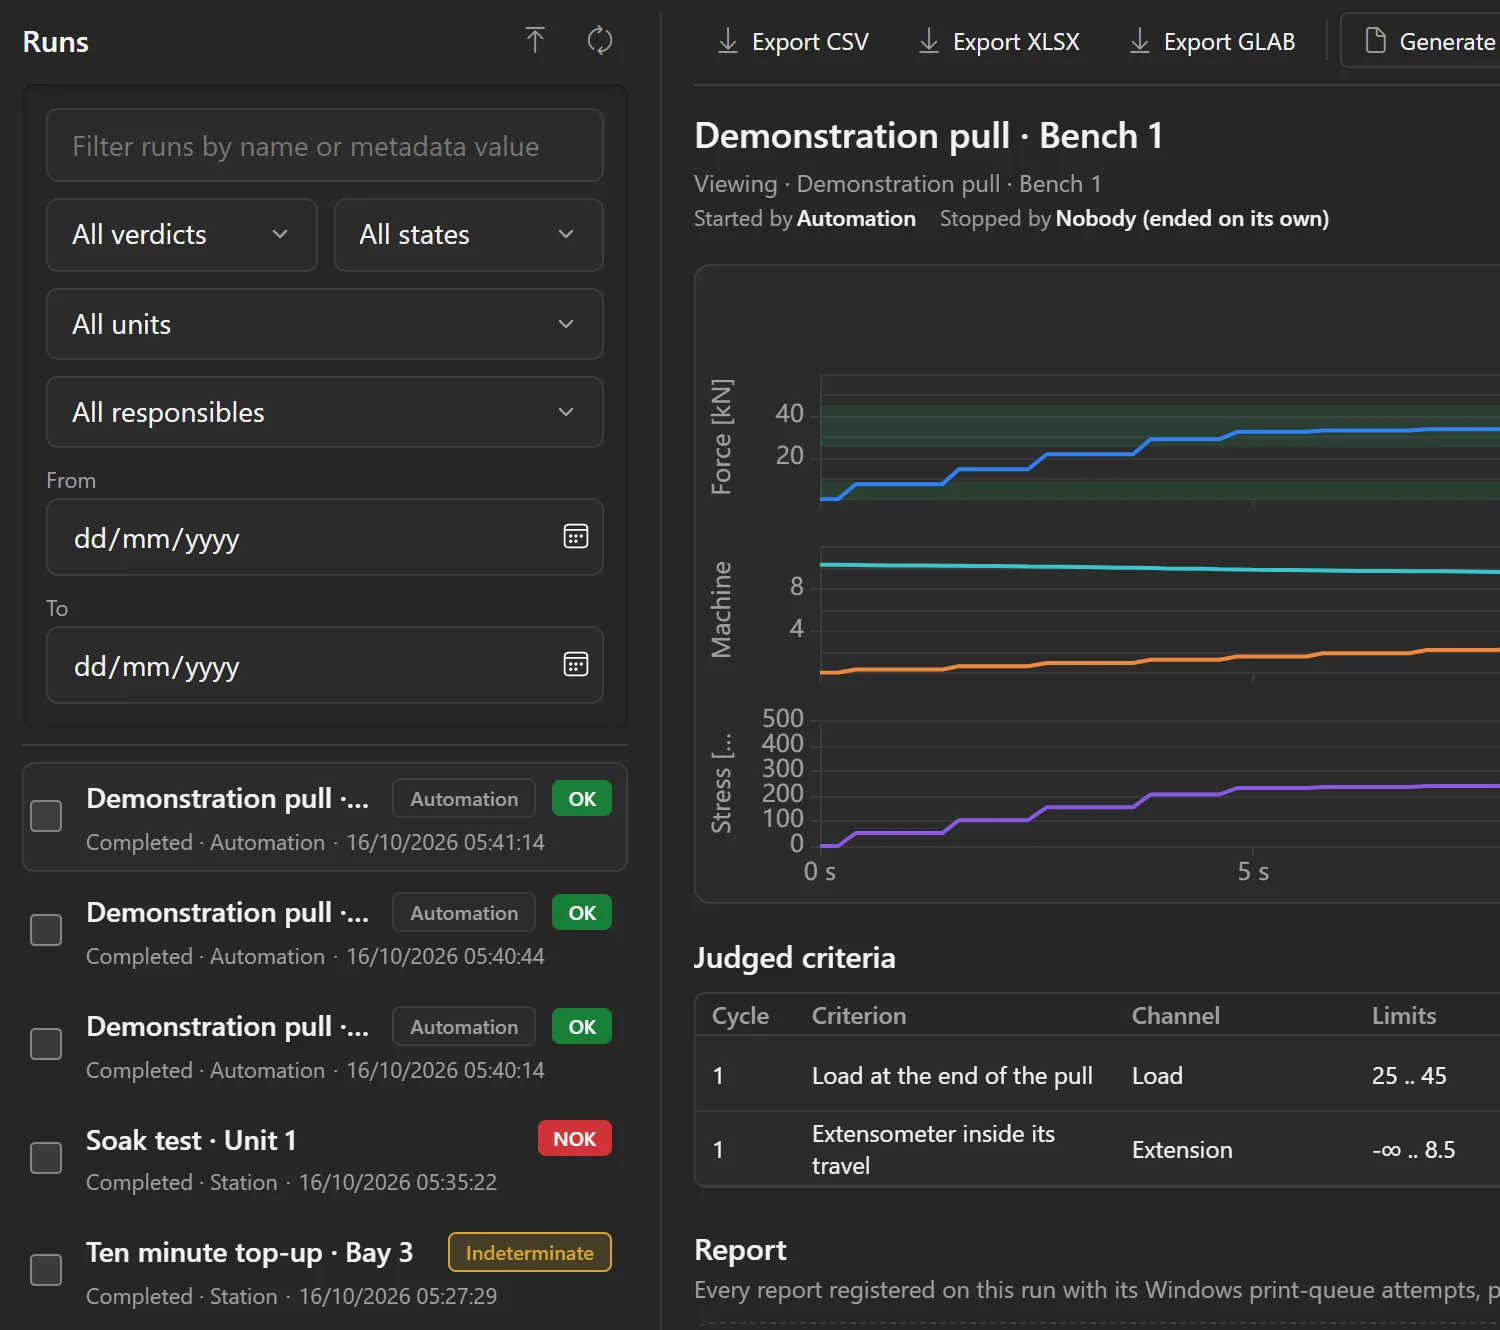
Every run, on record.
Each run records itself: its data, its occurrences, the operator, the sample and the lot.
- Reopen any run and compare it with another.
- Export to Excel or CSV.
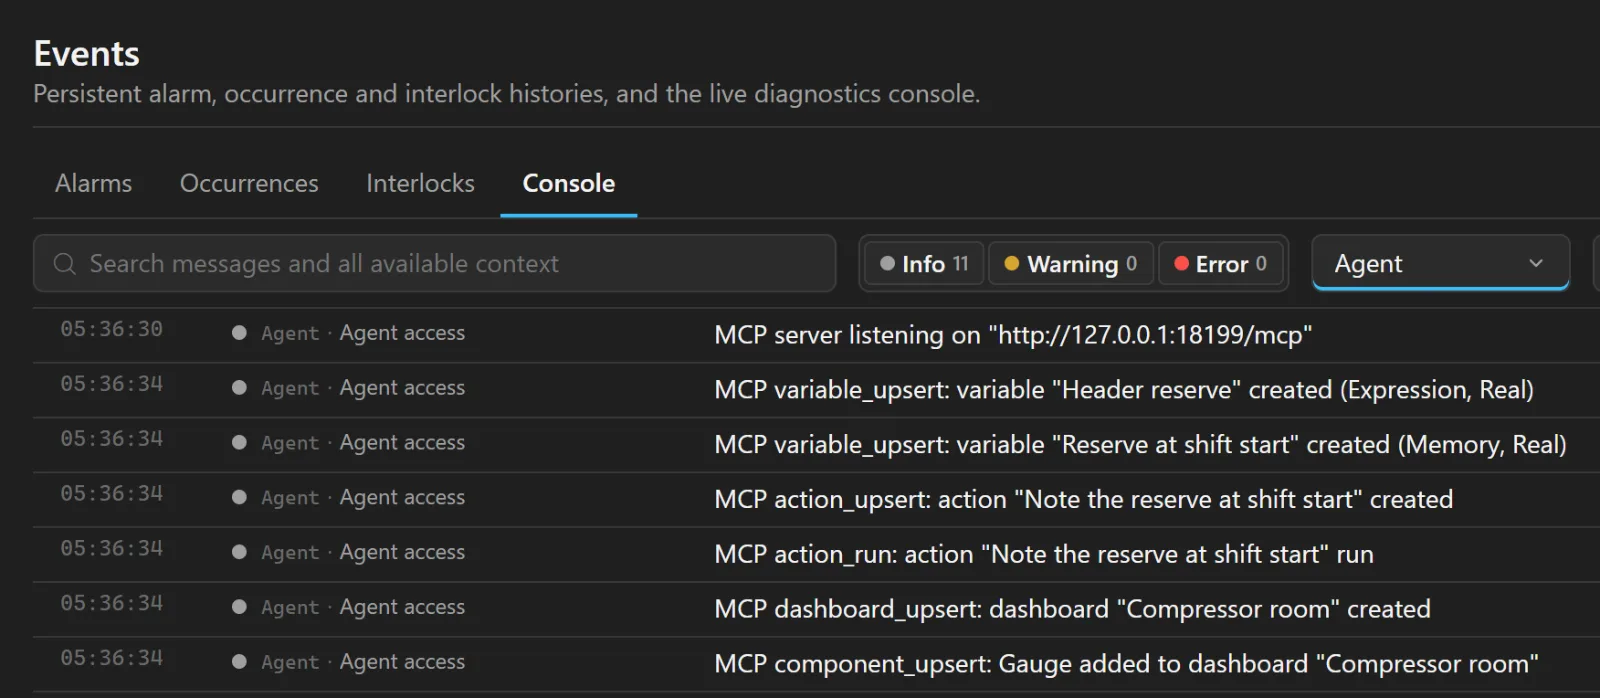
Do it all by asking.
Connect the assistant you already use. It speaks MCP, so it reaches the station directly.
- It builds: devices, tags, variables and screens, under the same rules as the pages.
- It explains, from the documentation of the version you installed.
- You decide what it may do: one switch per area, and every change it makes is journaled under its name.
Connect the PLC at 192.168.0.10 and create a screen with the oven temperature
Done: 1 device, 3 tags and 1 screen.
How do I create a high temperature alarm?
In Logic, press + and choose New alarm.
24 drivers, one catalog.
Every driver the installer carries, grouped the way the program's catalog groups them.
More in the docsPLCs
- Beckhoff ADS
- Mitsubishi MC
- Omron
- Rockwell EtherNet/IP
- Siemens S7
Industrial protocols
- BACnet
- Generic serial and TCP
- Modbus RTU
- Modbus TCP
- MQTT
- OCPP
- OPC DA
- OPC UA
- SNMP
Instruments and acquisition
- Fluke NetDAQ
- NI-DAQmx
- SCPI instruments
Wireless
- LoRaWAN
- Matter
Web and APIs
- AVEVA PI
- HTTP
- Redfish
Files and databases
- Database
- File
It runs on your computer, and your data stays there.
No cloud service to run it. Nothing leaves the station unless you turn it on.
| Security | Your data never has to leave the computer: network, remote and AI access are switches you turn on. |
|---|---|
| License | A subscription reaches the site once every 90 days; a perpetual license once, to activate. Both keep working offline. |
| Installation | Installs per user, without administrator rights, and updates itself in place. |
| Users & roles | Local accounts and roles decide who operates, edits and audits, and every action is attributed. |
| Diagnostics & backup | Health checks, journals, and a configuration backup you restore or carry to a second station. |
| Formats & themes | Light or dark theme, decimal comma or point and your date format, across charts, tables and exports. |
| Languages | The program, its offline help and this site in 11 languages. |
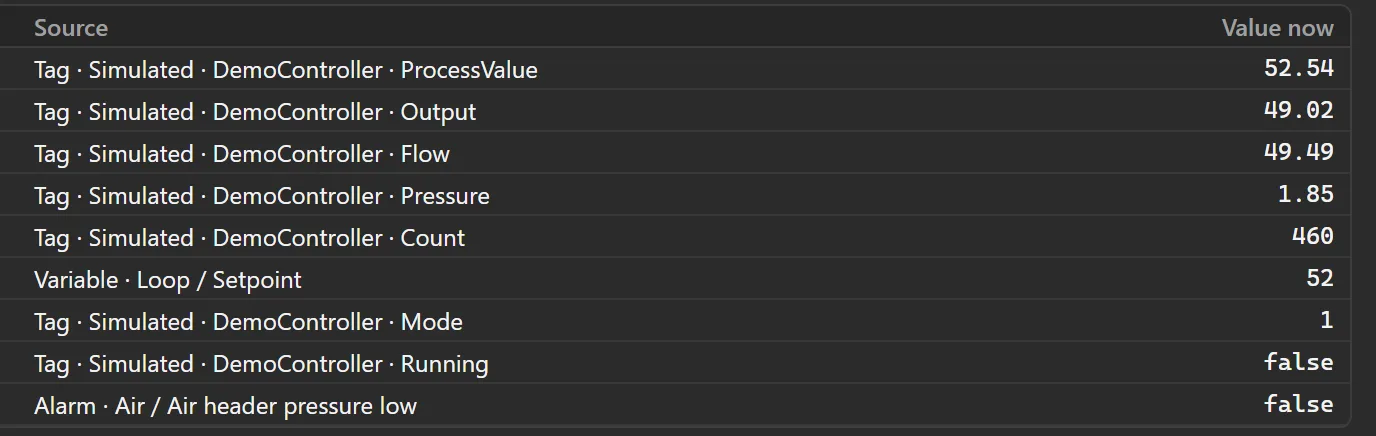
Your data, served out.
The station's own OPC UA server, Modbus TCP server and MQTT broker share the values you choose with the rest of the plant. Each one is off until you turn it on.
More in the docs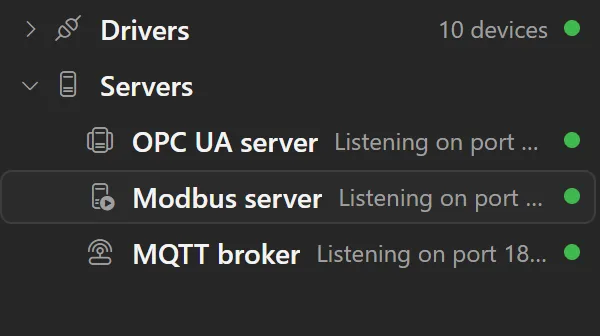
Remote access in the browser.
Any other computer or tablet on your network opens the station live in its browser, with nothing to install on it, each person on the screen they need.
More in the docs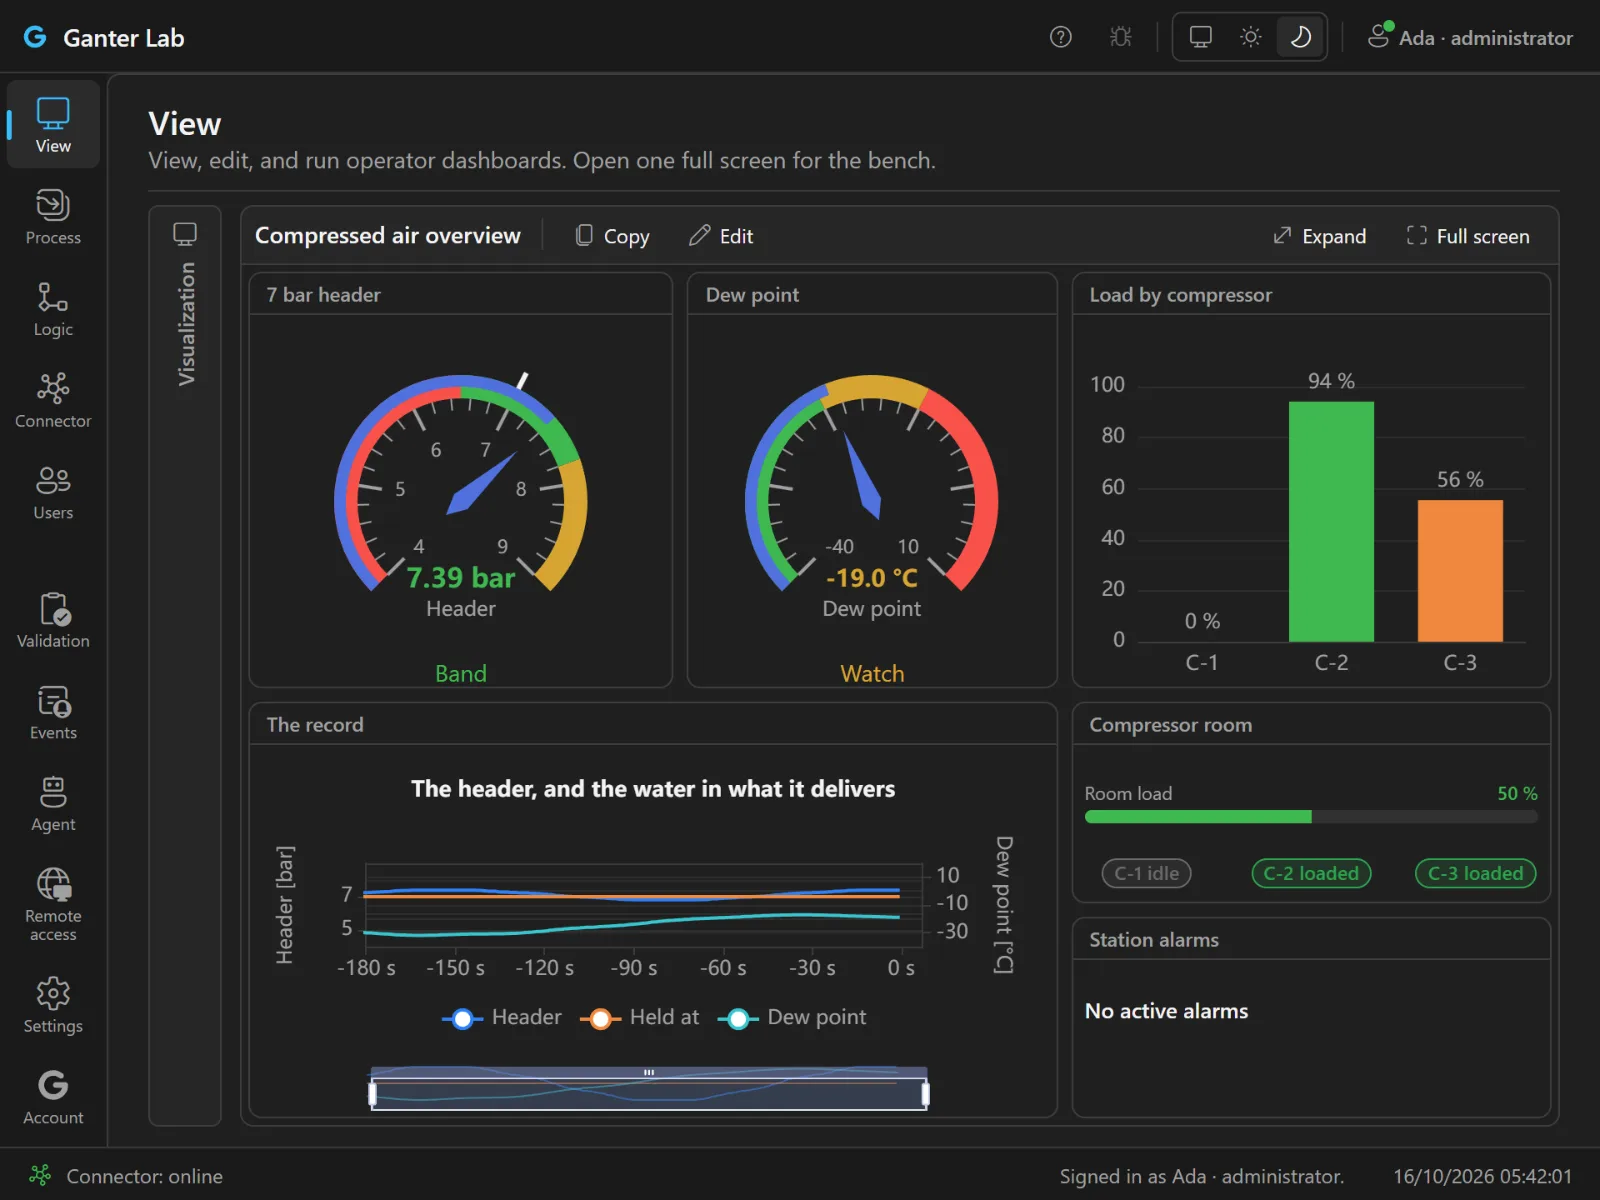
Pricing
Everything unlocked. You pay only to run nonstop.
Nothing is ever locked: drivers, logic, dashboards, processes and recording are always available, license or not. Without a license the runtime runs 1 hour at a time (2 hours signed in); restart it to carry on, as many times as you like. For short or occasional jobs, that can be all you ever need. One license per station removes the limit for continuous operation. That's the entire model: no tiers, no feature matrix.
Per station · monthly or annual · adjust anytime
Common questions
Do I need a license to try it?
No, and there is no trial to expire either. Free mode is permanent: install it and use everything; for occasional runs it may be all you ever need. Buy a license when a station needs to run without the timer.
Which AI assistants work with it?
Claude, Codex and any other assistant that speaks MCP. The documentation shows how to connect each one, and agent access stays off until you turn it on.
Does a licensed station need to be online?
No. With a subscription, the station only has to reach our site once every 90 days, and each contact renews its license for the next 90; without that contact, it runs in free mode until the next one. A perpetual license needs the internet once, when the station signs in to activate it, and then works offline for good.
What happens if I stop paying?
Nothing dramatic. The station falls back to free mode: every feature keeps working, but the runtime pauses on a timer (1 hour, or 2 hours signed in) until you restart it manually. A single failed payment never stops a licensed station.
Put your first machine on screen today.
Download it, connect a device or start with the built-in simulator, and build your first dashboard.
- Free to download, wire up and use
- 100% local: your data stays with you